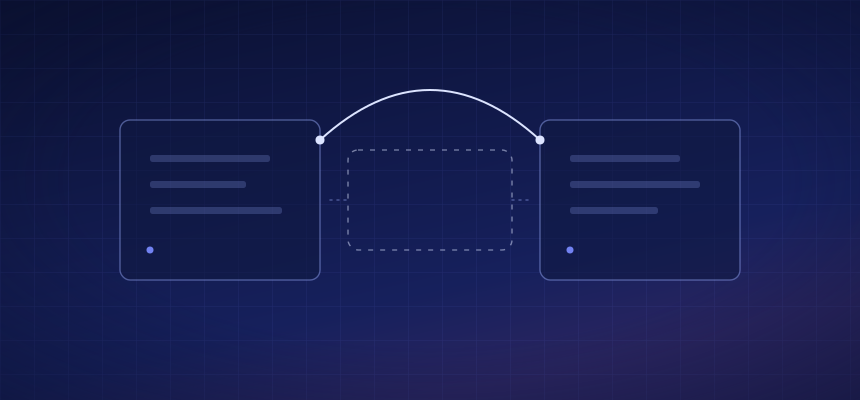
A business can have a dashboard for every department and still operate from several versions of the truth. Marketing sees campaign performance. Operations sees stock. Finance sees margin. Customer experience sees reviews and returns. Management receives a summary after each team has interpreted its own data.
The result is visibility without synchronization. The numbers are available, but the commercial meaning is reconstructed manually in meetings, messages, and spreadsheets.
Why more dashboards do not solve fragmentation
Dashboards are useful when the question is already known and the metric definition is stable. They are less effective when the business needs to understand a relationship across functions.
Consider a product whose sales declined this week. The channel dashboard may show lower revenue. The advertising platform may show stable ROAS. The inventory report may show intermittent availability. The pricing file may show a recent increase. The reviews feed may reveal a recurring product concern. Each system can be correct while the business explanation remains incomplete.
Adding another dashboard typically adds another view of the same fragmented process. It does not automatically reconcile product identifiers, align time periods, connect owners, or determine which factor had the greatest commercial impact.
What synchronized intelligence changes
Synchronized intelligence connects data and decisions around a shared business model. Orders, products, channels, campaigns, stock, costs, returns, and customer signals are analyzed together. The purpose is not only to centralize information. It is to preserve the relationships that explain performance.
The National Retail Federation observed that many retailers have already invested in commerce platforms, data infrastructure, and omnichannel capabilities. The next priority is making those investments work together in ways that improve margin, decision speed, and customer experience.[1]
This is the shift from reporting architecture to decision architecture.
Four signs that the business has a synchronization problem
1. The same KPI has different answers
Revenue, orders, units, returns, and ad-attributed sales may differ across systems because the scope, timing, cancellation logic, tax treatment, or attribution method is not the same. The debate moves to whose report is correct instead of what action is required.
2. Root-cause analysis begins after the meeting
A weekly review identifies the problem, but the team needs several follow-up files before it can explain the cause. By the time the analysis is complete, the operating window has narrowed.
3. Teams optimize isolated KPIs
Marketing increases spend on a high-ROAS product without seeing that inventory is close to critical. Operations reduces stock exposure without seeing that a campaign is about to increase demand. Finance questions margin after the promotion has already run.
4. Reports describe the past but do not assign the next action
The output says what changed but not which products, channels, owners, and deadlines should be prioritized.
A synchronized decision workflow
A stronger workflow starts with one business question. The relevant data is connected at product and channel level. The analysis tests multiple explanations. The output identifies the most material risks and opportunities. Each recommendation is assigned to the role that can act on it. The impact is reviewed in the next cycle.
McKinsey’s 2025 AI survey reinforces the importance of this workflow view. Organizations producing the most value from AI were more likely to redesign workflows, embed AI into business processes, track KPIs, and establish clear leadership ownership.[2]
Where DataSync is relevant
DataSync synchronizes commerce data and the organizational context around it. The platform connects data sources, learns business rules and user priorities, and uses SYNC AI to produce role-specific reports, root-cause analysis, warnings, opportunities, and recommended actions.
A marketing report can include stock and margin. An inventory report can include sales velocity and campaign pressure. An executive summary can connect performance, profitability, operational risk, and customer experience.
That is the difference between seeing more and deciding better. A dashboard surfaces information. Synchronized intelligence organizes the business around a shared interpretation and a faster response.
Sources
- [1] National Retail Federation. What's Next in Retail Tech?. April 17, 2026. Source link
- [2] McKinsey & Company. The State of AI: Global Survey 2025. November 5, 2025. Source link
See it on data shaped like yours.
DataSync connects marketplace, e-commerce, ERP, ad and stock data into one model, then routes each decision to the person who owns it.
Keep reading
- Executive Guide · August 24, 2026Why more dashboards don't produce better decisionsMost commerce teams no longer have a data problem. They have a decision problem — and every dashboard added to the estate quietly makes it worse.
- Product Education · August 21, 2026How Sync AI CX Agent Helps Commerce Teams Manage Product Questions at ScaleSync AI CX Agent is DataSync’s external customer response infrastructure. It uses approved product data and information sources to manage customer questions consistently at scale.
- Use Case · August 18, 2026How Customer Feedback Becomes Operational IntelligenceCustomer feedback becomes more valuable when it is connected to products, channels, returns, fulfillment, and sales. That connection turns sentiment into an operating signal.